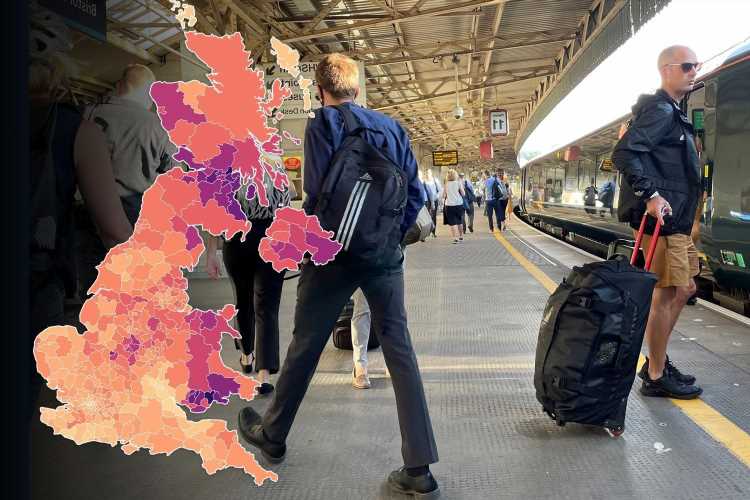
COVID cases have risen in 61 local authorities and this interactive map reveals if your area is on the list.
Cases have fallen in 315 areas across the country and a cluster of infections has become visible in Wales.


Of the 61 areas across the UK where cases have risen, Wales accounts for 16, government data up to September 17 states.
The rest come from England and Scotland, with no local authorities witnessing an increase in Northern Ireland.
Neath Port Talbot, Wales, has the highest rate in the UK, with 1,235 new cases in the seven days to September 17 – the equivalent of 855.3 per 100,000 people.
This is up from 699.5 in the seven days to September 10.
West Dunbartonshire has the second highest rate, down from 1,172.7 to 806.0, with 712 new cases.
Merthyr Tydfil, also in Wales has the third highest rate, up from 703.4 to 791.1, with 478 new cases.
Corby in Northamptonshire has the highest rate in England (639.3) and Fermanagh & Omagh has the highest rate in Northern Ireland (549.7).
The 61 places where Covid is still rising, is your area one of them?
The figure on the LEFT shows cases per 100,000 in the seven days up to September 17. The figure on the RIGHT shows infections, also per 100,000, in the seven days up to September 10.
- Neath Port Talbot, Wales, 855.3, (1235), 699.5, (1010)
- Merthyr Tydfil, Wales, 791.1, (478), 703.4, (425)
- Caerphilly, Wales, 701.6, (1275), 639.4, (1162)
- Rhondda Cynon Taf, Wales, 701.2, (1696), 557.7, (1349)
- Swansea, Wales, 689.9, (1701), 644.5, (1589)
- Blaenau Gwent, Wales, 645.5, (452), 522.7, (366)
- Vale of Glamorgan, Wales, 631.2, (854), 502.6, (680)
- Conwy, Wales, 605.8, (716), 510.2, (603)
- Allerdale, North-west England, 587.7, (575), 513.1, (502)
- Flintshire, Wales, 518.3, (813), 401.0, (629)
- Kettering, East Midlands, 514.6, (526), 428.5, (438)
- Barrow-in-Furness, North-west England, 491.6, (328), 398.6, (266)
- Torfaen, Wales, 488.2, (463), 456.6, (433)
- Gwynedd, Wales, 486.5, (609), 458.6, (574)
- Staffordshire Moorlands, West Midlands, 485.6, (478), 412.5, (406)
- Rugby, West Midlands, 485.3, (537), 416.6, (461)
- Tamworth, West Midlands, 485.3, (373), 448.8, (345)
- Cannock Chase, West Midlands, 483.8, (491), 474.0, (481)
- Newport, Wales, 469.8, (735), 436.6, (683)
- Blackpool, North-west England, 464.7, (643), 595.5, (824)
- Barnsley, Yorkshire & the Humber, 462.8, (1148), 435.8, (1081)
- Powys, Wales, 457.0, (608), 400.7, (533)
- Bridgend, Wales, 441.2, (651), 431.1, (636)
- Cardiff, Wales, 437.2, (1614), 377.8, (1395)
- Carlisle, North-west England, 429.4, (466), 401.8, (436)
- Stafford, West Midlands, 425.8, (587), 306.1, (422)
- Ribble Valley, North-west England, 424.0, (263), 367.6, (228)
- North Lincolnshire, Yorkshire & the Humber, 380.3, (657), 356.0, (615)
- Redditch, West Midlands, 379.8, (325), 330.7, (283)
- St Helens, North-west England, 378.8, (686), 356.7, (646)
- Cheshire East, North-west England, 378.6, (1464), 351.7, (1360)
- Lancaster, North-west England, 374.7, (555), 324.7, (481)
- Preston, North-west England, 369.8, (533), 348.3, (502)
- Bassetlaw, East Midlands, 369.5, (437), 329.7, (390)
- Ashfield, East Midlands, 341.3, (438), 336.6, (432)
- Daventry, East Midlands, 333.5, (290), 322.0, (280)
- Tunbridge Wells, South-east England, 327.9, (390), 254.8, (303)
- East Staffordshire, West Midlands, 320.0, (387), 318.4, (385)
- North Kesteven, East Midlands, 319.9, (378), 301.3, (356)
- Rossendale, North-west England, 317.8, (227), 250.6, (179)
- Derbyshire Dales, East Midlands, 313.4, (227), 249.9, (181)
- Sevenoaks, South-east England, 307.3, (373), 253.7, (308)
- Huntingdonshire, Eastern England, 303.9, (544), 278.8, (499)
- South Northamptonshire, East Midlands, 300.5, (287), 298.5, (285)
- Welwyn Hatfield, Eastern England, 297.8, (369), 276.0, (342)
- East Northamptonshire, East Midlands, 287.1, (273), 286.0, (272)
- Hart, South-east England, 286.9, (280), 256.1, (250)
- Oxford, South-east England, 281.0, (426), 273.8, (415)
- Elmbridge, South-east England, 272.6, (374), 260.9, (358)
- Tonbridge and Malling, South-east England, 272.3, (361), 250.4, (332)
- Epsom and Ewell, South-east England, 270.4, (219), 258.0, (209)
- Reigate and Banstead, South-east England, 267.3, (399), 251.9, (376)
- Rushmoor, South-east England, 257.5, (243), 254.3, (240)
- Surrey Heath, South-east England, 256.7, (229), 235.4, (210)
- East Hertfordshire, Eastern England, 255.0, (387), 253.0, (384)
- East Cambridgeshire, Eastern England, 245.1, (221), 217.4, (196)
- West Devon, South-west England, 240.5, (135), 217.3, (122)
- Monmouthshire, Wales, 236.4, (225), 230.1, (219)
- Adur, South-east England, 227.5, (146), 174.5, (112)
- West Lindsey, East Midlands, 222.5, (214), 220.4, (212)
- Comhairle nan Eilean Siar, Scotland, 150.9, (40), 124.5, (33)
Last week a cluster of cases had emerged in the East Midlands – but Scotland still remained the most infected part of the UK.
In the last seven days, there have been five areas that have seen a significant rise in cases – four of which are also in Wales.
Neath Port Talbot is at the top of the list up from 699.5 to 855.3 per 100,000 and is followed by Rhondda Cynon Taf which has also jumped from 557.7 to 701.2.
Vale of Glamorgan is third on the list, witnessing a jump from 502.6 to 631.2, followed by Blaenau Gwent – which has jumped from 522.7 to 645.5.
The only place on the list which is not in Wales, is Stafford in the West Midlands where cases have increased from 306.1 to 425.8.
In Wales, cases are highest in Neath Port Talbot, but have also spread to other areas such as Merthyr Tydfil, Caerphilly, Rhondda Cynon Taf and Swansea.
These areas have all witnessed an increase infections alongside Blaenau Gwen, Vale of Glamorgan, Conwy, Allerdale and Flintshire.
DREADED WINTER
The increase in cases in Wales comes after data from the Office for National Statistics (ONS) showed that deaths from Covid hit a six month high in the country.
It said that in the last week, 65 deaths in Wales had been down to the virus.
The Welsh ambulance service has also called for the army to help with winter Covid pressures.
It said it's under "significant and sustained pressure" due to Covid, combined with the flu and other winter challenged.
Staff in intensive care wards have said the pressure is 'concerning' and that shortages are making them 'dread' the winter months.
INFECTION INCREASE
Data published yesterday showed that daily Covid cases across the UK have spiked over the last week with deaths climbing.
A further 31,564 people tested positive for Coronavirus yesterday, a 19 per cent rise on the 26,628 recorded last Tuesday.
It marks the fourth day that daily cases have increased week-on-week.
Britain's death toll has also soared, with Tuesday's 203 fatalities a 9 per rise on this day last week.
But hospital admissions are dropping as 861 new patients were recorded last Thursday, the most-recent date with available data.
It marks a 25 per cent drop on figures recorded one week earlier.

We pay for your stories!
Do you have a story for The Sun news desk?
Email us at [email protected] or call 02077824104. You can WhatsApp us on 07423 720 250. We pay for videos too. Click here to upload yours
Click here to get The Sun newspaper delivered for FREE for the next six weeks.
Source: Read Full Article